set it up and running
If you already know what this is about and want to test it out-of-the-box just download the code and run DEMO.m. Otherwise, keep reading.
TBD-evaluation
Conventional experiments on Multi-Target Tracking (MTT) are built upon the belief that fixing the detections to different trackers is sufficient to obtain a fair comparison. Instead, we argue how the true behavior of a tracker is exposed when evaluated by varying the input detections rather than by fixing them. We propose a systematic and reproducible protocol and a MATLAB toolbox for generating synthetic data starting from ground truth detections, a proper set of metrics to understand and compare trackers peculiarities and respective visualization solutions.
proposed tools
This MATLAB toolbox is composed of three main components:
- Data degradation: this module is required to generate new detections from ground truth. It should only be employed for training, while generated data should be kept fixed for future comparison.
- Evaluation: this code partially extends the DEVKIT proposed at MOT Challenge (www.motchallenge.net) with the ability to measure tracks length and automatically process a whole set of detections at different pairs of control parameters.
- Result visualization: is needed to reproduce the exact same plots we reported in the original paper (see ref below).
data degradation
The toolbox provides 2 scripts to degradate the ground truth trajectories, createDetectionsFromGT_OCCLUSIONS.m and createDetectionsFromGT_ROBUSTNESS.m. The first one creates sets of detections with an increasing number of both occluded targets and occluded frames. The latter one instead, varies the detector precision and recall by inserting an increasing number of false positive and false negatives. Both the scripts have some configuration lines at the beginning, specifying the root folder of the toolbox and the name of the sequence to degradate.
baseFolder = 'D:\lab\TBD_evaluation';
datasetName = 'AVG-TownCentre';
% control parameters
P_range = 0.5 : 0.1 : 1;
R_range = 0.5 : 0.1 : 1;
% number of run to account for randomness
d = 5;
Additionally, it is also required to specify the range of variation of the control parameters (precision/recall in the reported example) and the number of detection sets generated at the same level of the parameters. The dataset name must also be the name of the folder which contains all the sequence info, in a tree structure similar to the one reported below. For example, for the sequence AVG-TownCentre:
AVG-TownCentre
|-- gt
|   |-- gt.txt
|-- det
|   |-- det.txt
|-- img
|   |-- 000001.jpg
|   |-- 000002.jpg
|   |-- ...
|-- robustness_data
|-- occlusions_data
The last two folders must be created but will be filled by the scripts that generates the degraded detections starting from the file gt.txt. The det folder is not mandatory and needs to be created only if true detector responses are available. The detections and ground truth format in the .txt files is the one adopted in the MOT Challenge benchmark. By running the scripts, a number of .txt files in the _data folders the will be created. This number is the product of the number of steps each control parameter has (6*6 in this case) and the number of runs (5 in the example).
evaluation
Now is the time to run the trackers you want to evaluate and create an output file for each detection file created in the previous section. Once you have these results, you should organize them in a directory tree as follows. Suppose we have tested a tracker named trk1, in the root folder of this toolbox we should find:
trackers
|-- trk1
|   |-- AVG-TownCentre
|   |   |-- occlusions_results
|   |   |   |-- AVG-TownCentre_P0.00_R0.00_01.txt
|   |   |   |-- ...
|   |   |   |-- AVG-TownCentre_P0.80_R0.60_03.txt
|   |   |   |-- ...
|   |   |-- robustness_results
|   |   |   |-- AVG-TownCentre_P0.00_R0.00_01.txt
|   |   |   |-- ...
|   |   |   |-- AVG-TownCentre_P0.80_R0.60_03.txt
|   |   |   |-- ...
|   |   |-- det_results
|   |   |   |-- det.txt
Inside the trackers folder, one folder must exists for each tracker one whish to compare. Inside each tracker specific folder, one folder for each sequence has to be created containing at least occlusion_results and robustness_results. These two folders must contain the .txt files of the tracker results. The name of the files must be the same one of the input detections file, so that the toolbox can parse the values of P and R (in the example) and the number of the run. Once these folder are set up as shown above, the script evaluateExperiments.m can be lunched. It only needs some configurations to reach the results files:
baseFolder      = 'D:\lab\TBD_evaluation';
trackerName     = 'trk1';
seqName         = 'AVG-TownCentre';
resultsFolder   = 'robustness_results';
The evaluation script is the same that can be downloaded from the MOT Challenge website. We only added a couple of lines to also save the generated tracks length to account for our proposed measure as well. As we didn't want to change anything else of the evaluation script by MOT Challenge, we also required to manually modify the evaluator > seqmaps > seq_to_test.txt and specify, in the second line, the name of the test sequence. First line must be left empty.
By running this script, a results.mat file is created inside each results folder. This .mat files contain all the CLEAR MOT standard metrics and our proposed tracks length measure.
result visualization
The last contribution of our toolbox is a set of plots obtained from the results.mat files generated in the previous sections. There are three types of plots, detailed in the paper (see reference below):
- MOTA matrices
- TL plots
- TL areas
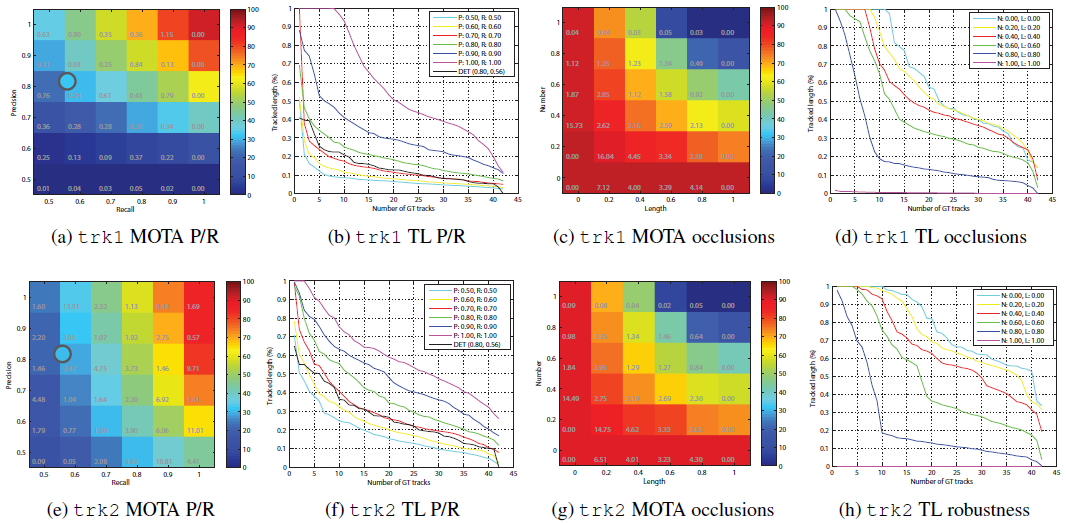
These plots are created for each tracker and for each sequence in the script createPlotsForSequence.m, while are averaged over all the sequences in the script createPlotsForDataset.m. For the single-sequence script, some parameter must be set:
baseFolder      = 'D:\lab\TBD_evaluation';
% names of the folders in "trackers" dir
trackerName     = {'trk1', ...};
seqName         = 'AVG-TownCentre';
% availability of true detection results (det_results folder)
plotDetection   = 1;
Similarly, these are the parameters for the dataset script:
baseFolder      = 'D:\lab\TBD_evaluation';
% names of the folders in "trackers" dir
trackerName     = {'trk1', ...};
sequences       = {'AVG-TownCentre', 'PETS09-S2L2', 'TUD-Stadtmitte', ...};
Moreover, a comparison plot which synthetically describes the TL curves is also produced:
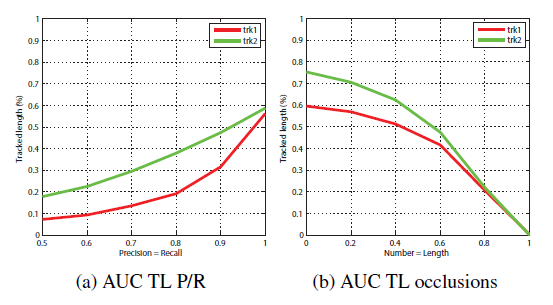
All the plots can easily be exported from MATLAB by saving them in pdf or eps format, preserving the vector quality of the figure.
data
By downloading the code, you can fully reproduce all the plots from the paper. This is because the plotting scripts use only the .mat result files created by the evaluation code, which are provided with the code. To reduce the size of this archive, we didn't include the synthtetic generated data and trackers results, but you can still download them from:
citation and contacts
If you use this code, please cite the following article:
Francesco Solera, Simome Calderara, Rita Cucchiara, "Towards the evaluation of reproducible robustness in tracking-by-detection"
Proc. IEEE Int'l Conf. Advanced Video and Signal Based Surveillance (AVSS), Aug 2015